
Weather Outlook
A DVB-T stick retrieves information from a professional weather station and stores it in a database for downstream processing.
If you frequently check the daily weather forecast, having your own weather station might be a good thing. However, professional devices are expensive, and they also mean that the amateur meteorologist is locked in to the display panels of the weather station vendor. As a rule, it is impossible to use the measured values in your own applications.
The cost driver is not typically the sensors in the weather stations, but the display modules. A DIY solution could handle the measurement-only tasks, but the sensor technology must be energy-saving and weatherproof. This is not easy to implement in a DIY project and adds to the overhead and costs. As an alternative, you could use the sensors of a professional weather station and draw on the data it provides for your project. In this article, I show you how to tap into the data stream of a weather station with a standard DVB-T USB stick, store the data in a database, and visualize it with Grafana.
Hardware
First of all, you need a sensor (Figure 1) suitable for your weather station project. Sensors like this are available for relatively little cash. I used a 5-in-1 outdoor sensor by Bresser for around EUR80. The price and features can vary, and similar sensors with more features can be obtained at a lower price; it might be worth doing a little research. Bresser seems to restrict shipping to Continental Europe – the AcuRite Iris 06014 PRO+ is a similar product that’s available from Amazon.
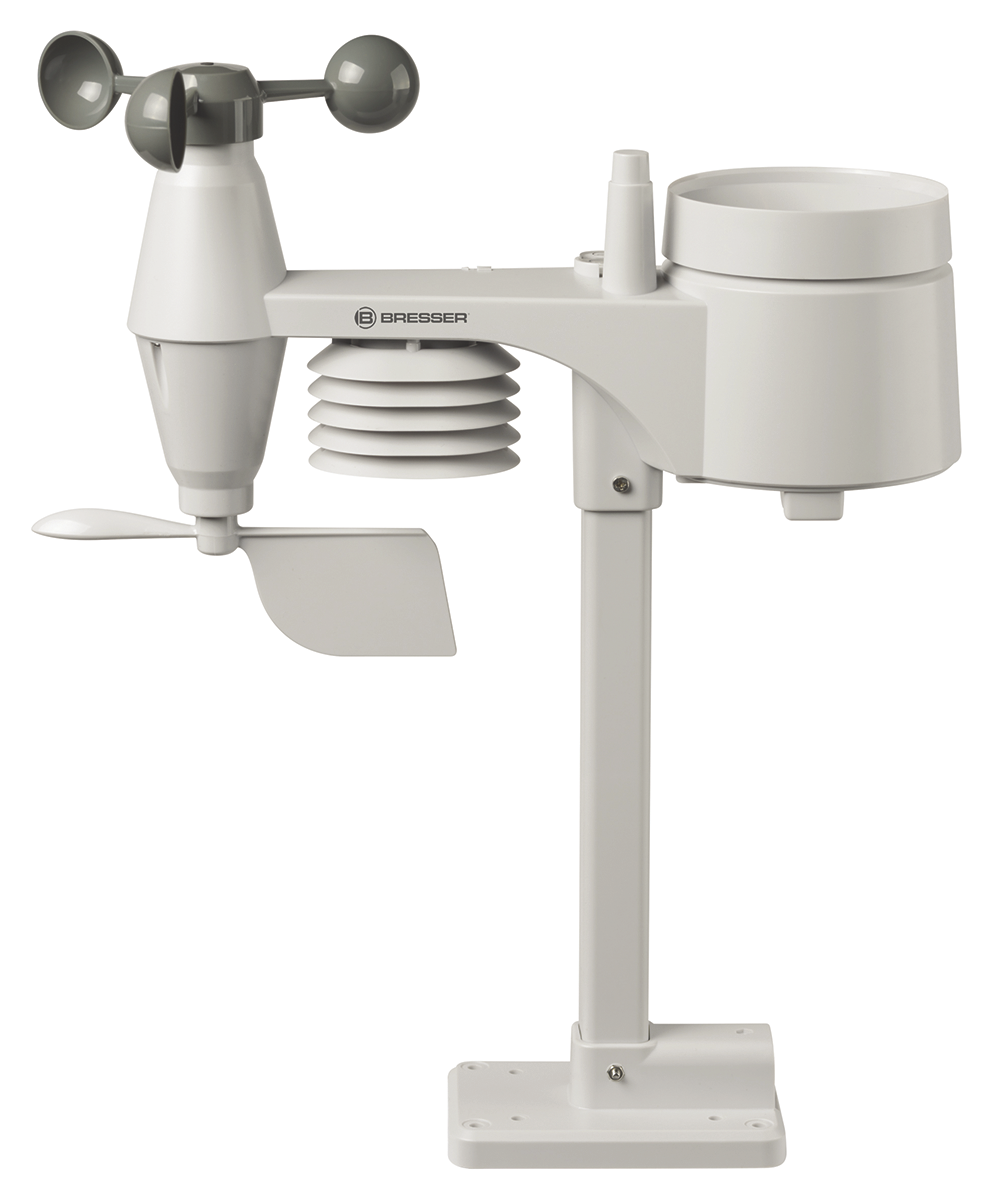
The Bresser sensor measures the temperature, humidity, wind speed, wind direction, and precipitation. It transmits on a frequency of 868 MHz; other devices use 433 MHz. During the installation, you need to point the sensor north and mount the sensor vertically. A small spirit level integrated in the housing and a marking on the sensor for north will help you with this.
To access the data stream that’s generated by the sensor, I used a standard DVB-T USB stick that is intended to receive digital radio and television signals via terrestrial channels. The stick has to support Software Defined Radio (SDR). It is also important to ensure that it is based on an RTL2832 chipset. My project uses the no-name 820T2 Digital USB 2.0 TV stick for around EUR27; Amazon lists a very similar-looking item for $36.
Software Setup
You can install the required software without any trouble (except for one inconsistency) on a recent Ubuntu system. The command
sudo apt-get install rtl-433installs the software on the system. During the installation process on my own computer, the program was not correctly added to the system’s search path, but it was still possible to work with it using the absolute path.
If you encounter similar problems, the alternative is to build the software from the sources. The commands required for this are shown in Listing 1. The code in the GitHub repository is more up-to-date than the version that you can install via the package manager, and in my tests it worked on the Ubuntu desktop on a Raspberry Pi without any problems.
Listing 1: Installing from Source Code
sudo apt-get install git libtool libusb-1.0-0-dev librtlsdr-dev rtl-sdr build-essential cmake pkg-config
mkdir weather && cd weather
git clone https://github.com/merbanan/rtl_433.git
cd rtl_433/
cmake .
make
sudo make install
To check whether everything has worked, start a trial run after compiling by typing
rtl_433 -f 868M -T 120If that gives you an error message, you first need to set the authorizations for the USB device. Detailed instructions can be found in the “Modifying Udev” box. To avoid the authorization worries for an initial test, you can use sudo just this once.
The
rtl_433 software accesses the DVB-T stick via USB. That will normally require root privileges, unless you explicitly allow a normal user to talk to the device files. You can create a configuration file that grants access rights for the specific device. These access rights can be managed in a very granular way. In our case, we just need to set up authorizations for all devices by one vendor. This is done using the unique vendor ID (idVendor).The
lsusb command offers a quick way to determine this identifier: It lists the names and IDs of all the USB devices on the bus. For the stick that I have used in this project, the output is Bus 003 Device 011: ID 0bda:2838 Realtek Semiconductor Corp. RTL2838 DVB-T, and it contains the manufacturer ID (0bda) and the model ID (2838).To assign the authorizations, you first need to create a suitable file in the folder
/etc/udev/rules.d/ working as root. The file name must follow the convention used and clearly state what function the file has. In my example, I named the file 60-DVBT-Stick.rules. The first line of Listing 2 shows the entries required for all users to be able to access devices by this vendor. To enable the rules without rebooting, use the commands in Listing 2.Listing 2: 60-DVBT-Stick.rules
$ echo 'SUBSYSTEMS=="usb", ATTRS{idVendor}=="0bda", MODE:="0666"' | sudo tee /etc/udev/rules.d/60-DVBT-Stick.rules
$ sudo udevadm control --reload-rules
$ sudo service udev restart
$ sudo udevadm trigger
Setting Up the Database
I have used MariaDB to store the measured values from the weather station. To install the database software, type the command shown in the first line of Listing 3. The following commands create a database (Bresser) along with a matching user account (dbuser). As the user can only access the database via localhost, the password does not have to comply with strict security guidelines. In the newly created database, create a table named measurements for the data.
Listing 3: Creating the Database and User Account
$ sudo apt install mariadb-server libmariadb3 libmariadb-dev
$ sudo mariadb
Welcome to the MariaDB monitor. Commands end with ; or \g.
Your MariaDB connection id is 31
Server version: 10.6.16-MariaDB-0ubuntu0.22.04.1 Ubuntu 22.04
[...]
MariaDB [(none)]> CREATE DATABASE Bresser;
Query OK, 1 row affected (0.000 sec)
MariaDB [(none)]> GRANT ALL ON Bresser.* TO 'dbuser'@'localhost' IDENTIFIED BY 'PaSsWoRd!';
Query OK, 0 rows affected (0.001 sec)
MariaDB [(none)]> FLUSH PRIVILEGES;
Query OK, 0 rows affected (0.001 sec)
MariaDB [(none)]> CONNECT Bresser;
Connection id: 32
Current database: Bresser
MariaDB [Bresser]> CREATE TABLE measurements(id INT auto_increment NOT NULL, PiT DATETIME NOT NULL, id_sensor INT NOT NULL, battery_ok INT NOT NULL, temperature_C FLOAT NULL, humidity FLOAT NULL, wind_max_m_s FLOAT NULL, wind_avg_m_s FLOAT NULL, wind_dir_deg FLOAT NULL, rain_mm FLOAT NULL, CONSTRAINT Bresser_PK PRIMARY KEY (id));
Query OK, 0 rows affected, 1 warning (0.006 sec)
MariaDB [Bresser]> exit
Bye
Saving Data
A Python script handles the task of storing the data transmitted by the sensor in the database. You need a library to access the database with Python; it can only be installed in a virtual Python environment. Use the commands from Listing 4 to set up the environment including the library.
Listing 4: Python Environment
python -m venv bresser
source ./bresser/bin/activate
cd bresser/
pip3 install mariadb
Now run the Python script from Listing 5 in the environment. It executes the rtl_433 tool in a child process (line 5) and writes the received values into variables (lines 10-23); it then uses the variables to create an SQL command (lines 27-30) that stores those values in the database.
Listing 5: Saving Measured Values
01 import subprocess
02 import json
03 import mariadb
04 id="3229280"
05 mesurements=subprocess.run(['/usr/local/bin/rtl_433','-f868M','-T30', '-Fjson'], stdout=subprocess.PIPE).stdout.decode('utf8').split('\n')
06 for line in mesurements:
07   print(line)
08   if id in line:
09     values = json.loads(line)
10     if "temperature_C" in values:
11       temperature_C=values["temperature_C"]
12     if "wind_max_m_s" in values:
13       wind_max_m_s=values["wind_max_m_s"]
14     if "wind_avg_m_s" in values:
15       wind_avg_m_s=values["wind_avg_m_s"]
16     if "wind_dir_deg" in values:
17       wind_dir_deg=values["wind_dir_deg"]
18     if "rain_mm" in values:
19       rain_mm=values["rain_mm"]
20     if "battery_ok" in values:
21       battery_ok=values["battery_ok"]
22     if "humidity" in values:
23       humidity=values["humidity"]
24 try:
25   con = mariadb.connect(user="dbuser", password="PaSsWoRd!", host="localhost", port=3306, database="Bresser")
26   cur=con.cursor()
27   sql="INSERT INTO Bresser.measurements "
28   sql=sql+"(PiT, id_sensor, battery_ok, temperature_C, humidity, wind_max_m_s, wind_avg_m_s, wind_dir_deg, rain_mm )"
29   sql=sql+" VALUES(now(), "+str(id)+", "+str(battery_ok)+", "+str(temperature_C)+", "+str(humidity)+","
30   sql=sql+str(wind_max_m_s)+", "+str(wind_avg_m_s)+", "+str(wind_dir_deg)+", "+str(rain_mm)+");"
31   cur.execute(sql)
32   con.commit()
33   con.close()
34 except mariadb.Error as e:
35   print(f"Error connecting to Database: {e}")
36   sys.exit(1)
Automate with Crontab
To regularly store the current measured values in the database, you will need to run the script cyclically. You can use the Cron daemon on the Raspberry Pi to do this. It automatically executes the programs defined in the Crontab configuration file: That is where you define the times at which you want a program to launch. For our sample script, you can use the entry from Listing 6. To edit the Crontab, type crontab -e. A detailed description of how Cron works can be found in an older Linux Magazine article.
Listing 6: Crontab
*/5 * * * * /home/pi/wetter/bresser/bin/python /home/pi/wetter/bresser/bresser.pyWhen saving the measured values, it is important to note that the data can occupy a large amount of space on the SD card over time. It is important to think about a strategy for handling the data. The easiest approach is to delete data after a certain period of time. Alternatively, you can create a daily data record containing a summary of the weather data.
Visualization
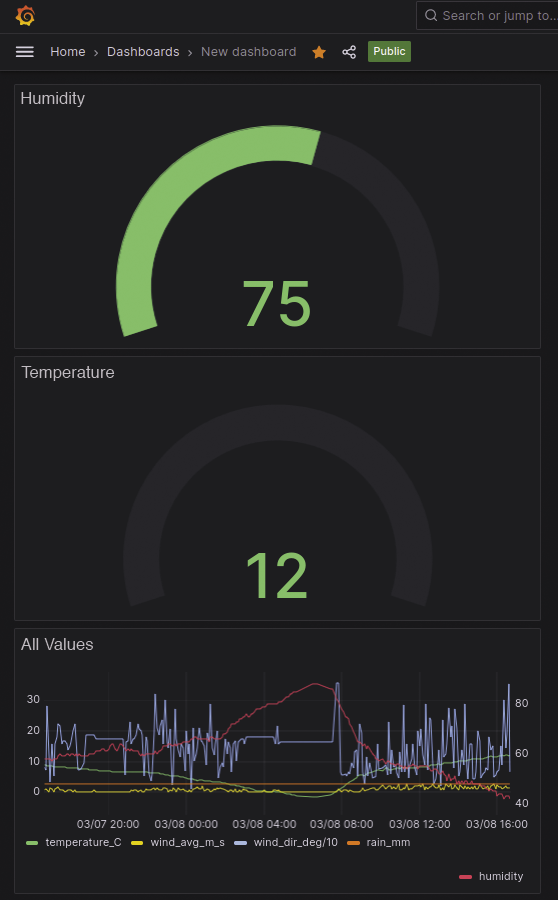
Grafana is a useful platform for visualizing your measured values. The tool’s website gives you all the information that you need to setup Grafana and then configure a data source (your SQL database) that will allow for data visualizations as shown in Figure 2.
Conclusions
It has certainly impressed me that a standard DVB-T USB stick can retrieve data from a weather station. This data can be stored and processed in a database with relatively little effort. Things get really exciting if you use the measurements to control a heating system or blinds – ioBroker [8, 9] is one of the tools that enable such functionality. For more information on ioBroker, see the “Home Director” article from Linux Magazine.