Worth a Thousand Words
Use an SVG graphic widget on your next Node-RED project to get a visual representation of your automation setup.
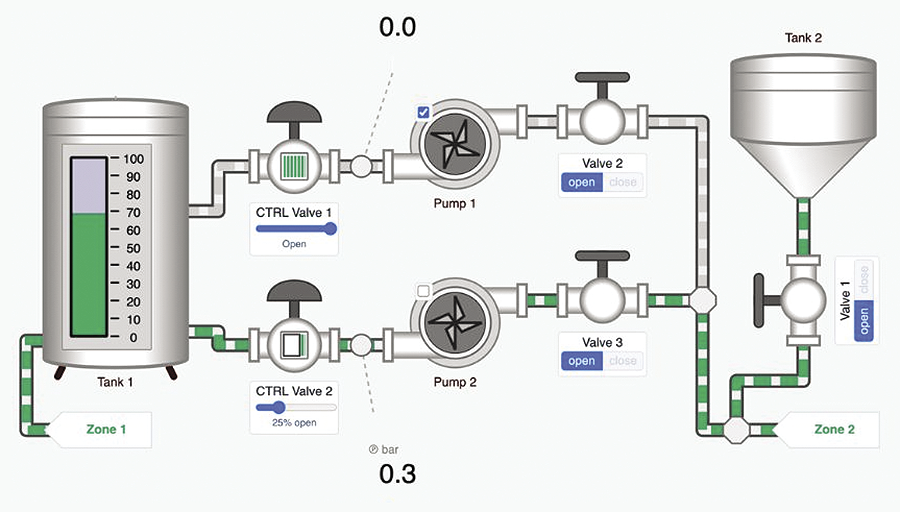
There are some great components for showing tables, gauges, and charts on Internet of Things (IoT) dashboards. For many applications these data widgets are all that you need – however, for industrial or process monitoring projects, it can be extremely helpful to add dynamic visual layouts of the equipment. Figure 1 is an example of a process automation screen that could be used for an industrial control system.
Node-RED is a powerful open source graphical programming tool that you can use for creating IoT logic scenarios and user dashboards. It runs on Linux, macOS, and Windows, and it’s an excellent tool for prototyping or building small system solutions. Typical Node-RED projects use the standard dashboard components, but it’s also possible to install an SVG widget that lets you show animated graphics alongside the other dashboard objects. Scalable Vector Graphics (SVG) is an XML-based vector image standard that is supported on all major web browsers. SVG files support dynamically changing text, color, rotation, and scaling of objects.
In this article, I’ll show you how to use Node-RED with the SVG widget to animate a small Raspberry-Pi-based home watering system.
Getting Started
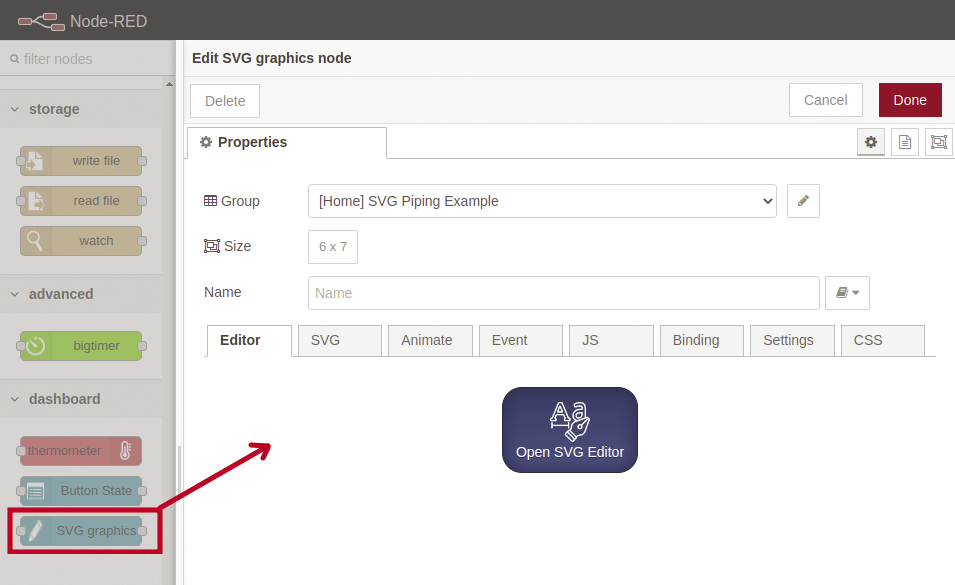
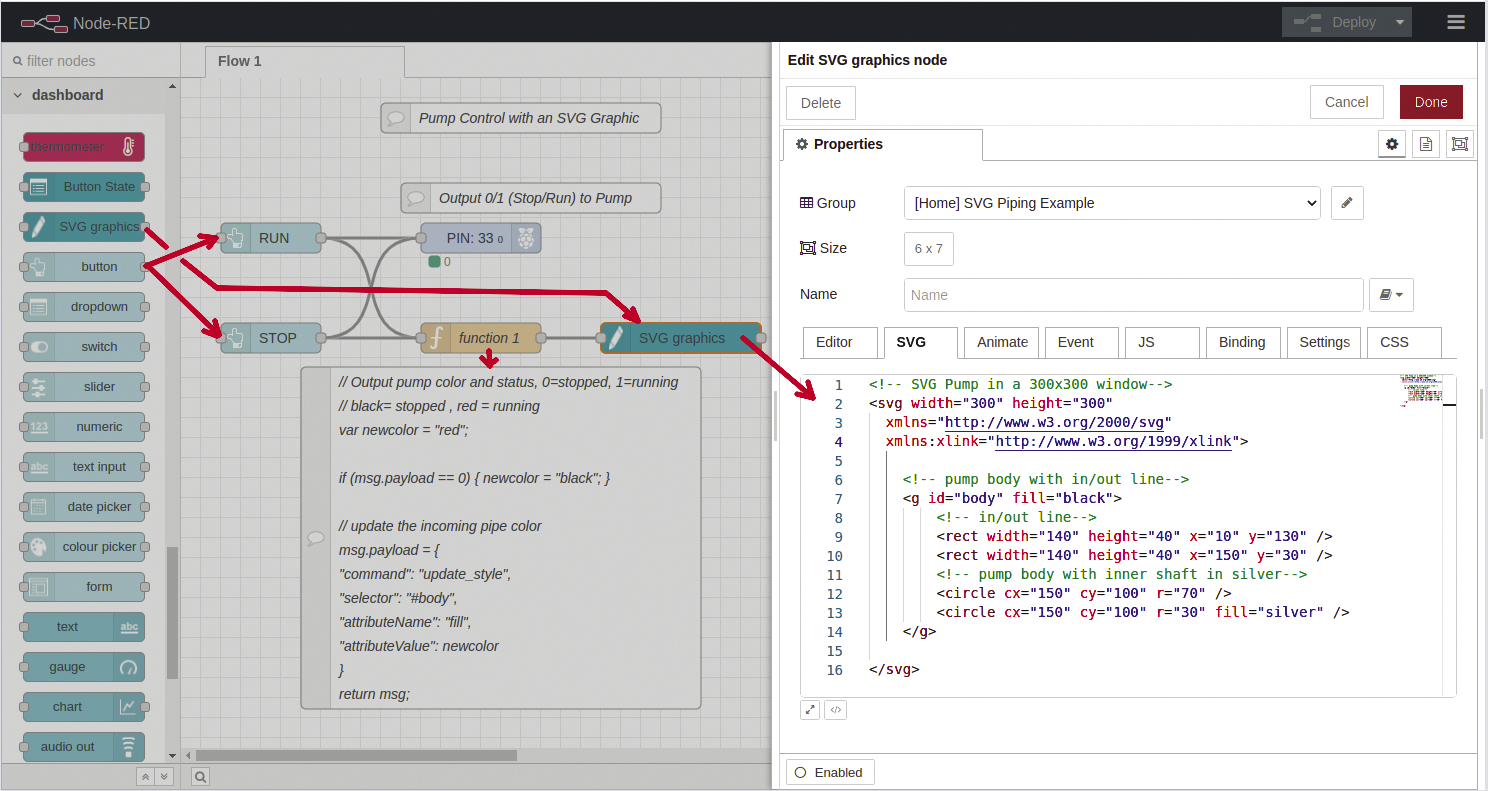
In the Get Started section of the Node-RED homepage, you can find specific installation directions for your hardware. You should use the latest version of the Node-RED web dashboards – check the version in the Manage Palette option. Add the SVG graphic component (Node-RED-contrib-ui-svg) via Manage Palette and select the Install tab. Once you’ve installed the component, you can drag and drop it on the Flow page like any other widget. The SVG flow has a built-in graphic editor, and you can also insert code manually in the SVG tab (Figure 2). The component also supports animations (for simulation), event handlers, JavaScript integration (from within the SVG drawing), and binding links between SVG items.
SVG Pump Example
As a first example, I wanted to build a basic on/off pump. When creating simple graphics, I found that I had more control writing the code manually rather than using the Node-RED SVG graphic editor. You can write SVG files in any text editor and view the resulting graphic presentation in any browser.
SVG files start with an <svg> tag and end with an </svg> tag (Figure 3). The opening tag also needs to have xmlns (namespace) and xmlns:xlink parameters (lines 3 and 4). The pump example consists of four elements: two horizontal rectangles for the in and out pipes (lines 9-10), a large circle for the pump body (line 12) and a smaller circle for the inner motor shaft (line 13). A group tag (<g>...</g>) combines all elements, and its id parameter gives the group a logical name so that it can be referenced from other code. In this example, the pump group’s id name is body.

It is important to note that no colors were defined for any of the shapes, except the inner circle (pump motor shaft), because the inner circle’s color will remain unchanged while the rest of the pump body will be set dynamically in the next step.
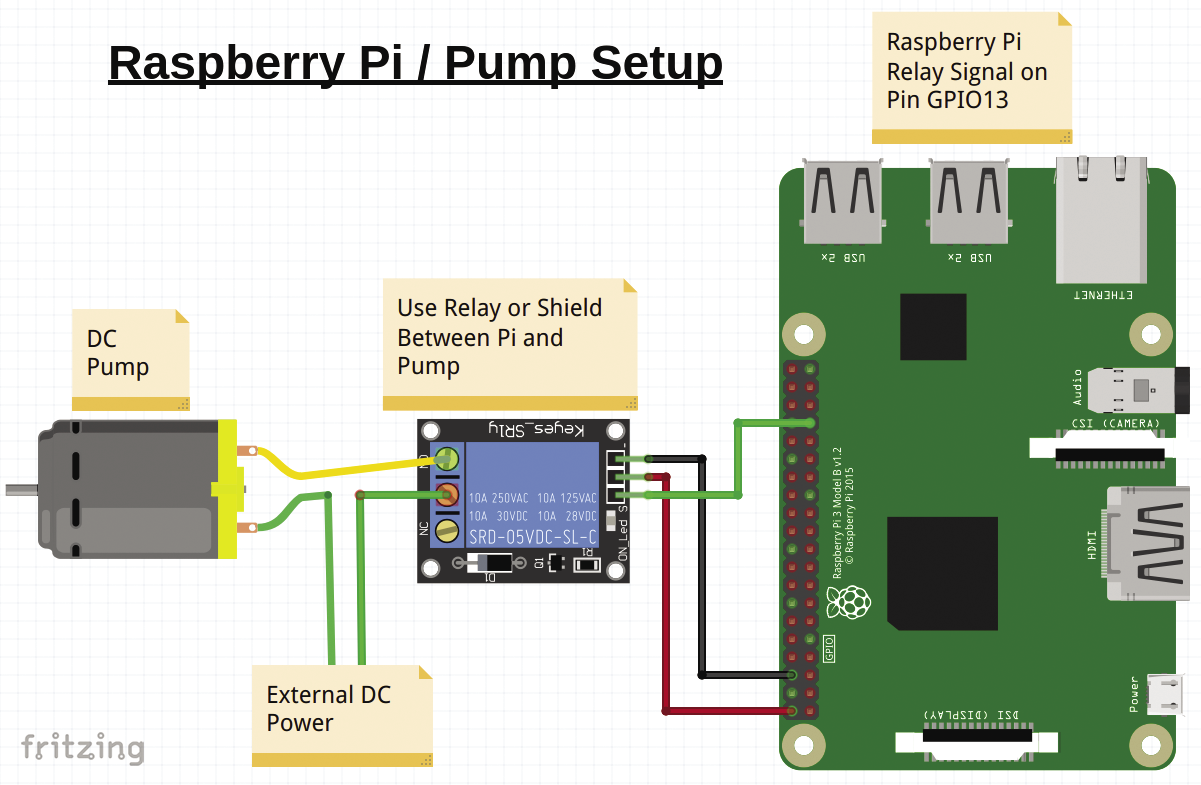
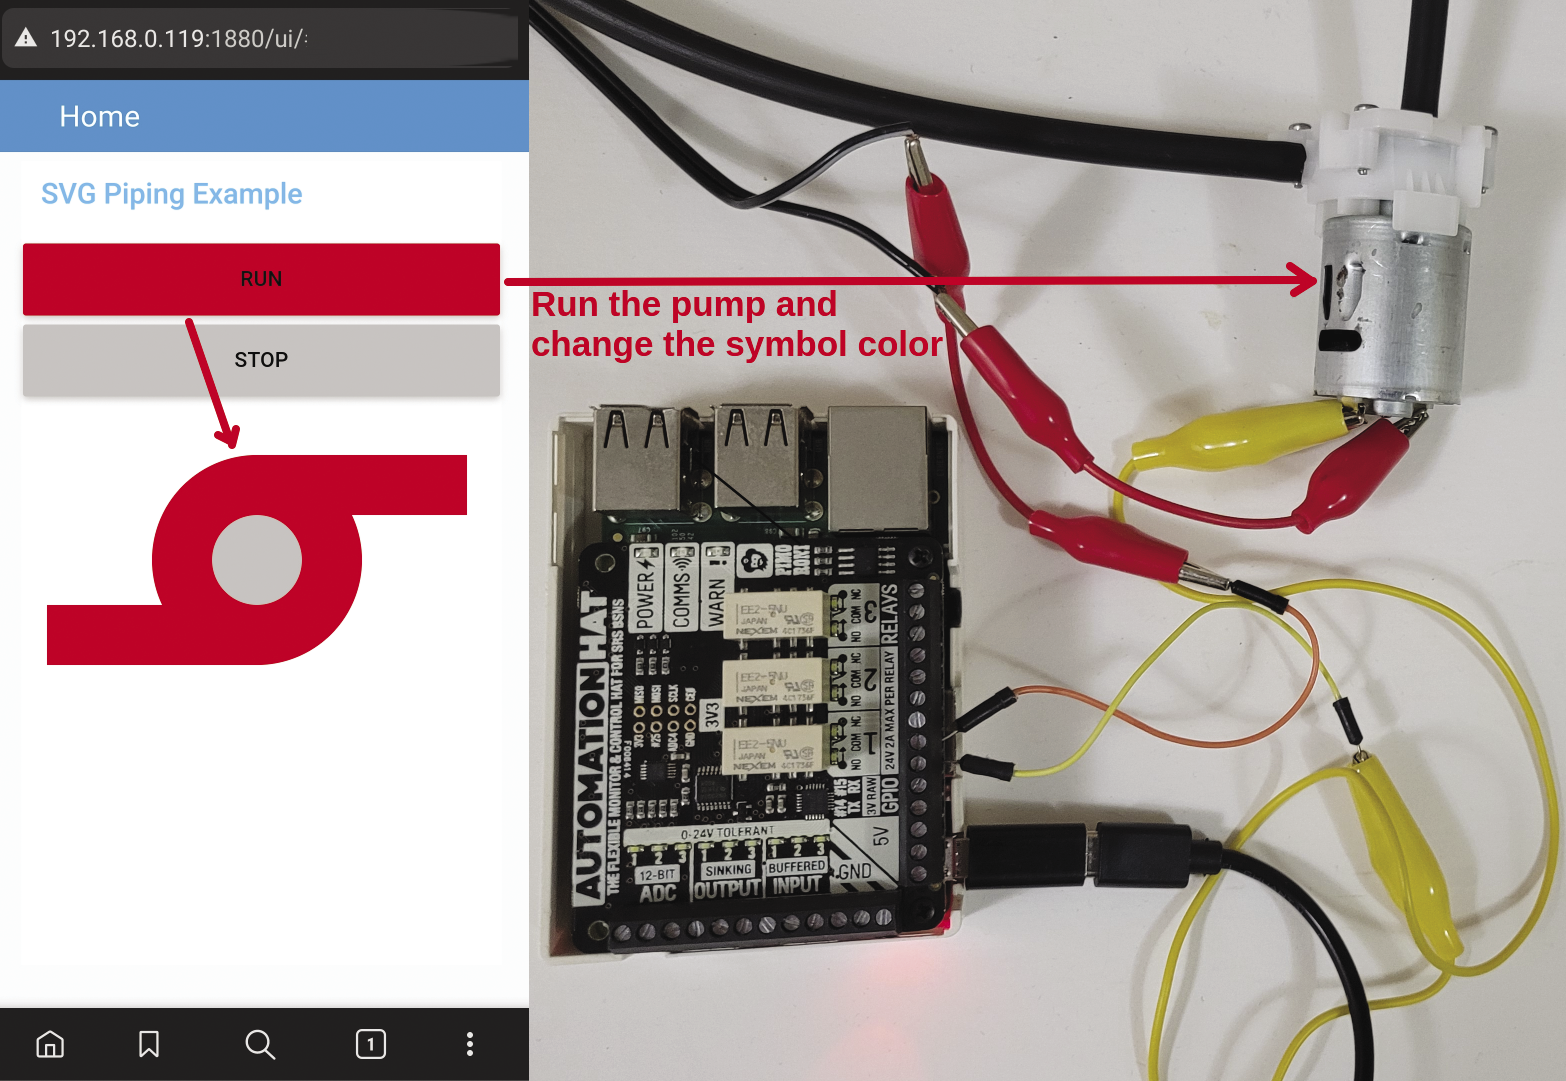
My hardware setup uses a Raspberry Pi with a Pimoroni Automation Hat, but any relay module would work (Figure 4). A relay offers isolation between the high power requirements of the pump and the Raspberry Pi. After connecting the hardware to the Raspberry Pi, I had to install the Node-RED GPIO widget. Typically the GPIO components are included in the Raspberry Pi Node-RED installation – if not, you can add them manually via:
cd ~/.Node-RED
npm i Node-RED-node-pi-gpio
The Node-RED logic for this pump project uses only five nodes to show the SVG graphic and control the pump (Figure 5): I use two dashboard buttons, RUN and STOP, for user input to send a 1 or 0 to the GPIO node, on pin 13. The SVG graphics node had the manually created pump code pasted into the SVG tab.
You can modify SVG elements by passing commands in the message payload. Some of these commands are add_event, set_attribute, pan, trigger_animation, update_style, update_text, and zoom. See the SVG graphic node documentation for more details.
The Function node (Listing 1) reads the user input (msg.payload, line 5) to define a new pump color. It then outputs a new msg.payload that includes the update_style command, which changes the fill color of the SVG pump selected by the #body id (lines 8-13).
Listing 1: Update SVG Pump Color
01 // Output pump color and status, 0=stopped, 1=running
02 // black= stopped , red = running
03 var newcolor = "red";
04
05 if (msg.payload == 0) { newcolor = "black"; }
06
07 // update the incoming pipe color
08 msg.payload = {
09     "command": "update_style",
10     "selector": "#body",
11     "attributeName": "fill",
12     "attributeValue": newcolor
13 };
14 return msg;
Figure 6 shows the running Node-RED pump dashboard with the Raspberry Pi test setup. When you select the RUN button, the relay is energized (state = 1) and the pump starts; in addition, the SVG pump color changes from black to red (the energized state). As a single pump is not overly useful, I’ll add some valves and piping in the next example.
Valve Symbols
In the pump graphic, the pump is a grouped entity. This approach works well for single use objects, but creating a symbol is a better solution for projects that require multiple instances of an item. The SVG element <defs> is used to store graphical objects that will be used at a later time. Inside the <defs>...</defs> tags, I can define symbols.
In the next example I define a valve symbol (Figure 7, lines 7-10): The shape of the valve is a <polyline> that crisscrosses to create two triangles (line 9). The <use> element references symbols, and it sets their x,y coordinates while also passing scaling, rotation, and configuration parameters like fill color (lines 13-14). It’s important to give each symbol instance a new ID name (e.g., valve1, valve2, etc.).

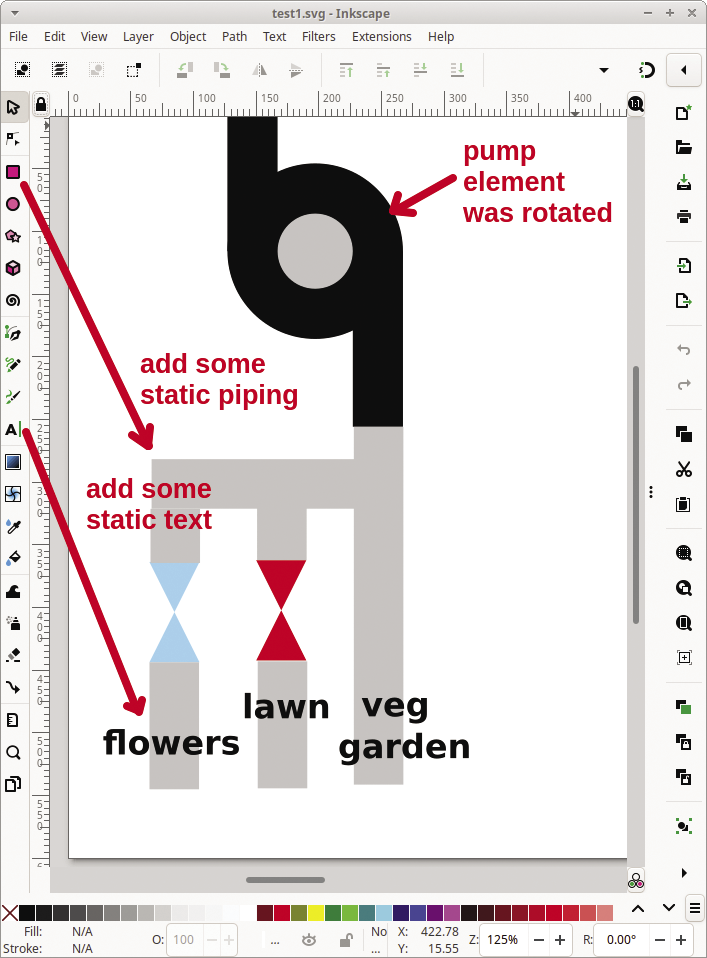
myvalve is reusable via a <use> element.After testing the valve symbols, the next step is to merge the pump and the valves files and then add some pipes to connect things. Unfortunately, the Node-RED SVG editor isn’t quite designed for this, but luckily there are a number of free apps like Inkscape that can do this (Figure 8).
For the Node-RED pump/valve example, I simplified the configuration so that I can focus on the SVG animation. To keep things lean, I used a Button State widget that creates a single object which is an array of buttons instead of working with six individual buttons. You need to install the widget with:
npm i Node-RED-contrib-ui-button_state
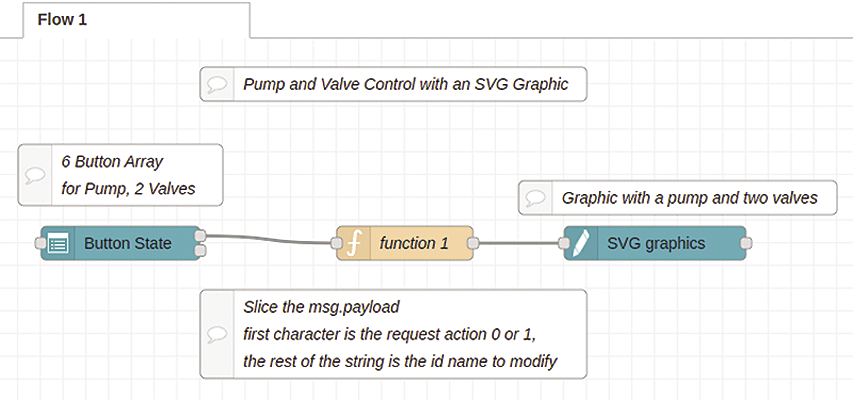
The second example requires only three nodes (Figure 9): The Button State node contains the user interface for turning the pump on and off and the open/closed states for the two valves. The Function node, as in the first example, changes the fill color of SVG elements. Finally the SVG graphics node is updated with the new SVG code that I created in Inkscape.
I’ve set six buttons for the Button State node (Figure 10). The PUMP ON and VALVE n OPEN get red backgrounds, while the PUMP OFF and VALVE n CLOSE buttons use silver. The Button State node’s msg.payload will send a string with the requested value and the ID name. As an example, pressing PUMP ON will pass a "1body" payload, and PUMP OFF outputs "0body".
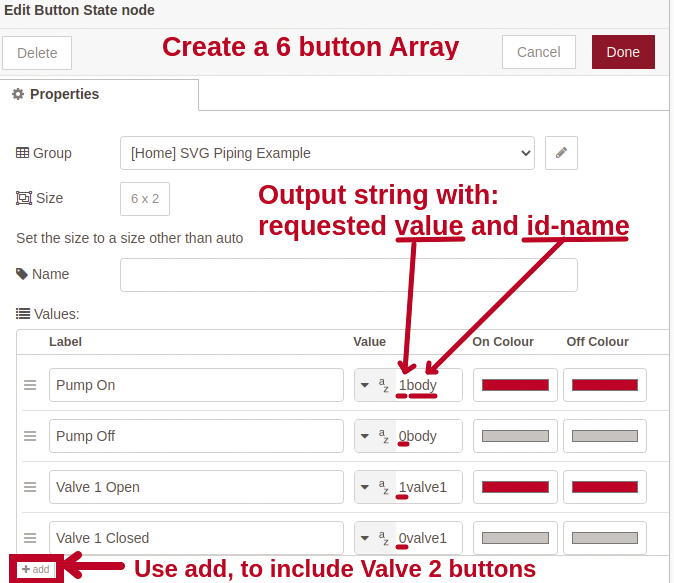
The Function node will parse the Button State node’s msg.payload to find the requested state and ID name and then update the SVG graphic accordingly (Listing 2). Lines 5-6 use the JavaScript slice() function to get the first character and the rest of the string. Line 14 inserts the ID name of the passed SVG element (thename) into msg.payload.
Listing 2: Six Button Array
01 // Slice the msg.payload
02 //   first character is 0 or 1,
03 //   the rest of the string is the ID name to modify
04
05 var thevalue = msg.payload.slice(0,1);
06 var thename = msg.payload.slice(1,);
07
08 var newcolor = "red";
09 if (thevalue == 0) { newcolor = "black"; }
10
11 // update the requested SVG element color
12 msg.payload = {
13     "command": "update_style",
14     "selector": "#" + thename,
15     "attributeName": "fill",
16     "attributeValue": newcolor
17 };
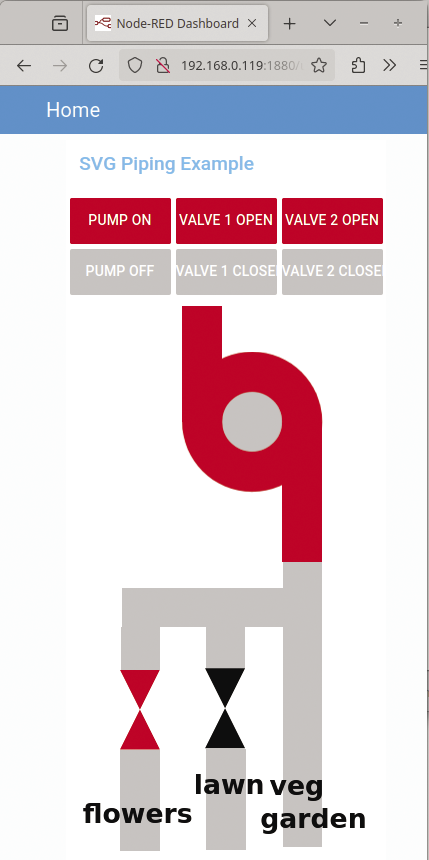
The final dashboard (Figure 11) lets me toggle the states of the pump and the two valves. A refined version includes a useful background image that shows the real-world objects affected by the control mechanism.
More Complex Graphics
The examples I’ve shown so far use extremely simple SVG graphics. Creating complex drawings from scratch can be a challenging and time-consuming exercise. Luckily, you can download files from free SVG libraries that can greatly speed up your design efforts. Some industrial process control vendors (e.g., Opto 22) offer high resolution graphics for free or a low price. You can merge downloaded SVG files with your existing files in the same way as earlier with the pump and valves files. Use apps like Inkscape to resize, rotate, or reposition objects.
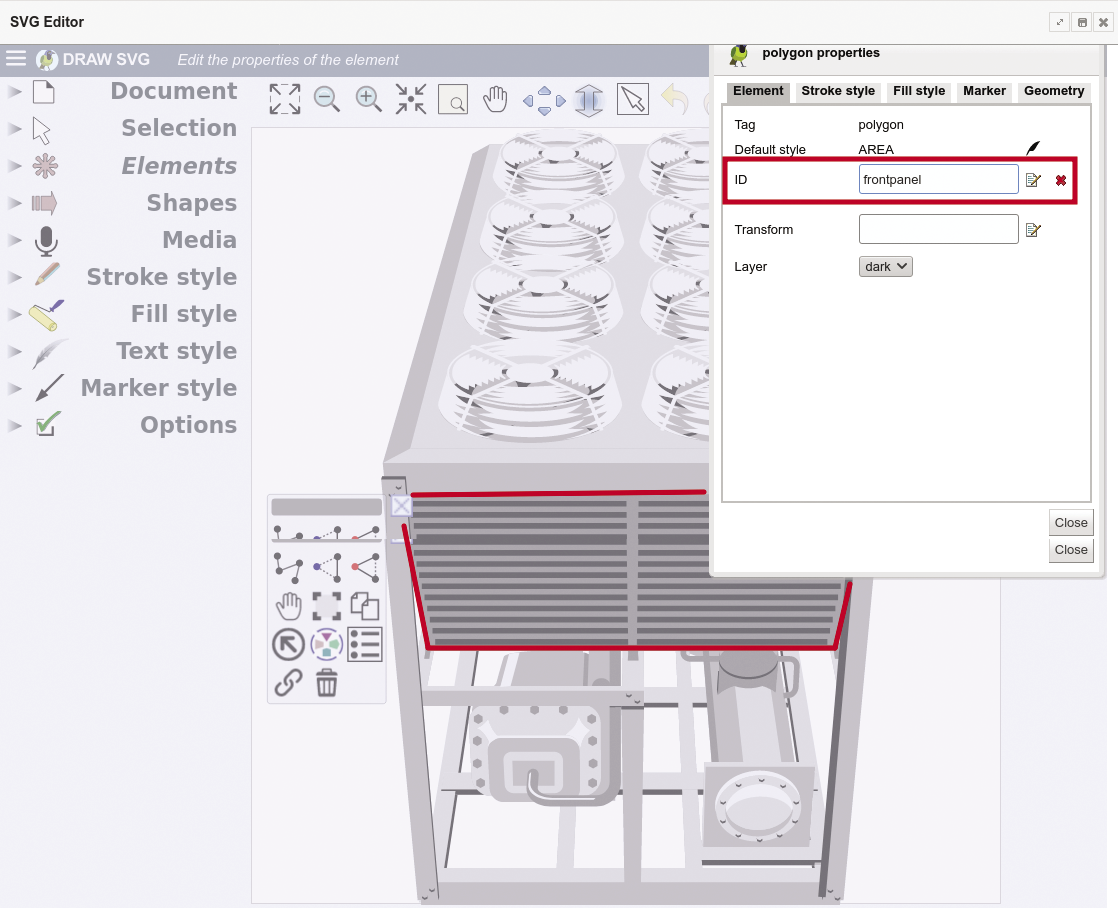
One of the challenges in working with downloaded SVG files is identifying the pieces and parts that you want to manipulate in your application. Figure 12 shows how the built-in SVG graphic editor is used to isolate the front panel on an industrial cooling unit. Once the required element is identified, it can be given an ID name and then accessed from code.
Summary
I’ve briefly covered creating basic symbols. Understanding the SVG syntax will greatly improve your efforts in designing graphics. For example, if you can download a free SVG file, you can add a <symbol> tag around a selected element and then reuse the image multiple times in your overall drawing. The Node-RED SVG widget has some incredibly powerful features that are worth investigating further – I’ve only discussed the update_style command, but there are many others.
A good use case for Node-RED SVG graphics might be to overlay your house floor plan with equipment such as lighting, temperature, cameras, and other powered devices.

